

 The Albedo Logo was born from a graph of Makiko Sato, Earth Institute professor at Columbia University.
Makiko Sato collaborates with James Hansen, Climate Science, Awareness and Solutions Program Director at Columbia University, and former director of NASA’s Goddard Institute for space studies.
For more graph and articles by Makiko Sato and James Hansen:
http://www.columbia.edu/~mhs119/
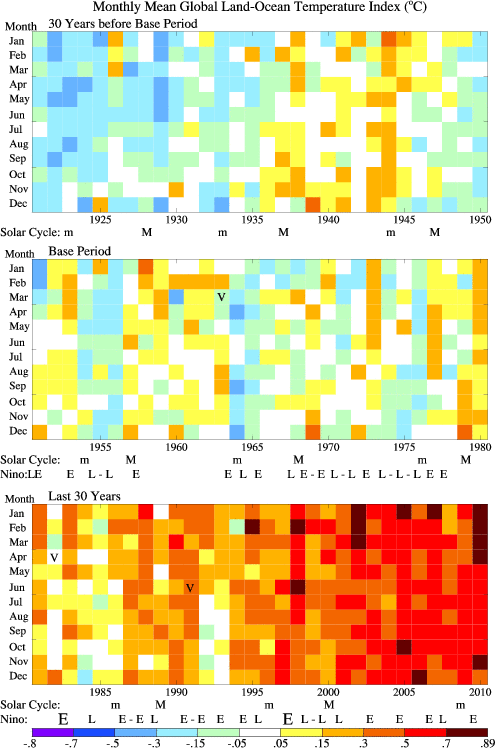
This graph represents the Earth-Ocean’s global monthly average temperature.
Each column represents one year. Each square is therefore a month. The upper left square represents January 1921. Lower-right hand square represents December 2010.
Each rectangle represents 30 years, from 1921 to 1950, 1951 to 1980 then 1981 to 2010.
The reference period is 1951 to 1980. Average January temperature is defined calculating all temperatures of January at this period.
Colors show the difference in temperature compared to the average temperature of the reference period. Therefore, June 1929 was from -0,5°C to -0,3°C colder than the June average temperatures between 1951 and 1980.
November 2010 was between +0,7°C and +0,89°C warmer.
We can then evidently see the sketch of the impact of anthropic global warming.
Natural Factors :
V : Volcanic Eruptions
The emission of ashes and sulfur dioxide form, in high altitude, a layer of aerosols inducing a radiative forcing. Particles reflect the sunlight and we can observe a global cooling of the atmosphere.
m and M : Solar Cycle Minimal and Maximal Phases.
The Schwabe solar cycle (8 to 13 years, average : 11 years) is the most famous of four variations of solar activity. It leads to a variation of a sun emitted energy flux of 0,1%.
E and L : El Niño and La Niña
According to the World Meteorological Organization, El Niño is a cyclic phenomenon, characterized by a positive anomaly of the sea surface temperature. In the Pacific Ocean, off the coast of Peru, water warms up by a few degrees.
This concentration of heat and humidity affect the climate of the entire planet.
La Niña brings a negative anomaly of the ocean’s temperature. The effect is opposite and stretched areas on earth are cooler than usual.